Nine in Ten 'Critical' CVEs Show No Sign Anyone Is Exploiting Them
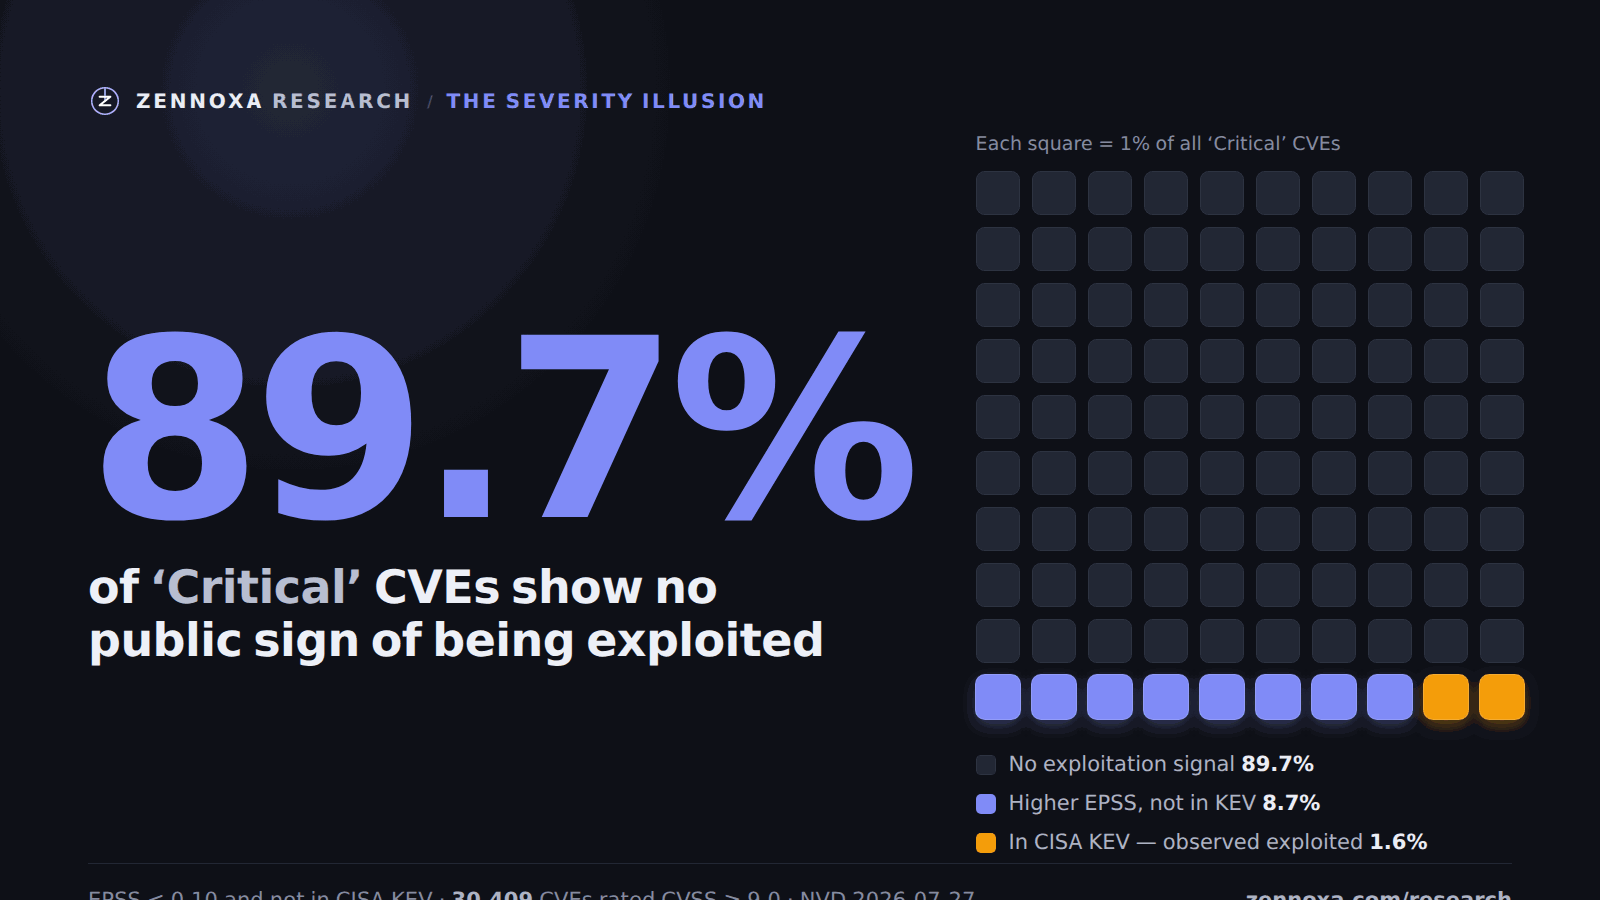
We joined three free public datasets — NVD CVSS scores, FIRST EPSS probabilities, and the CISA KEV catalog — on CVE ID. Of 30,409 CVEs rated CVSS 9.0+ ('Critical'), 89.7% carry an EPSS exploitation probability below 0.10 and are absent from the KEV catalog. A reproducible measure of how much of a severity-first queue is urgent by label but by no exploitation signal.
TL;DR — We took every CVE that NVD rates CVSS 9.0+ ("Critical") and joined it, by CVE ID, to two independent public exploitation signals: the FIRST EPSS probability score and the CISA KEV catalog of vulnerabilities observed exploited in the wild. Of 30,409 Critical CVEs, 89.7% (27,285) carry an EPSS probability below 0.10 and never appear in KEV — urgent by severity label, but flagged by neither probability nor observed exploitation. Even at the far stricter population-median EPSS cutoff, 25.1% of Criticals still clear that bar of "no exploitation signal." Only 478 (1.6%) of all Criticals are in KEV. Every number below is reproducible from three free datasets and a deterministic join.
Why measure this
Most vulnerability programs triage by severity: work the Criticals first. It's the default because CVSS is everywhere and easy to sort on. But a CVSS base score measures potential impact under worst-case assumptions — not whether a vulnerability is, or is likely to be, exploited. Two free public signals estimate the second thing directly:
- EPSS (Exploit Prediction Scoring System, by FIRST) assigns every scored CVE a probability from 0 to 1 that it will be exploited in the next 30 days.
- KEV (CISA's Known Exploited Vulnerabilities catalog) lists the vulnerabilities the U.S. government has observed being exploited in the wild.
When a large share of "Critical" CVEs sit below any reasonable EPSS threshold and never enter KEV, a severity-only queue is spending its scarcest resource — the top of the list — on items that the best public exploitation evidence does not consider pressing. This study measures that share. It's a statement about the data, not about any product.
What we counted
Three pinned public snapshots, joined on CVE ID. No modeling, no manual labeling, no proprietary step.
- NVD CVE API 2.0 — the "Critical" universe: every CVE whose CVSS v3 severity is
CRITICAL(base score ≥ 9.0). Snapshot taken 2026-07-27: 30,409 Criticals out of 370,431 total published CVEs. - FIRST EPSS current-scores CSV — model v2026.06.15, score date 2026-07-26, 352,717 CVEs scored. Population median EPSS = 0.00716 (the distribution is heavily right-skewed, so most CVEs score very low).
- CISA KEV JSON catalog — version 2026.07.24, 1,653 entries.
Every one of the 30,409 Criticals had an EPSS score (0 missing), so the join is complete on the EPSS side — no Criticals are silently dropped.
The result
We define "no exploitation signal" as: EPSS below a stated threshold AND not in KEV. Because EPSS is right-skewed, the threshold matters, so we report three — from strict to operational — rather than pick one:
| "Low EPSS" threshold | Criticals below it and not in KEV | Share of 30,409 |
|---|---|---|
| Population median (EPSS < 0.00716) | 7,628 | 25.1% |
| Percentile < 50 | 7,638 | 25.1% |
| EPSS < 0.10 (≈10% exploitation probability) | 27,285 | 89.7% |
Read the two ends honestly. At the population-median cutoff — the stricter test — about one in four Criticals still carries no exploitation signal at all. At the EPSS < 0.10 cutoff — an operational "is there a meaningful chance this gets exploited?" line — it's roughly nine in ten. Either way, the population of severity-urgent-but-evidence-free CVEs is not a rounding error; it's the bulk of the Critical bucket.
And the overlap that should be at the top is tiny: only 478 Criticals (1.6%) appear in KEV. A "Critical-first" queue, worked top-down, reaches those 478 only after wading through tens of thousands of same-labelled peers with no public exploitation signal.
Why this is the whole premise of risk-based prioritization
This is the empirical foundation for ranking findings by more than severity. A
prioritizer that blends signals — Zennoxa Shield's Priority Engine scores each finding
as CVSS·0.30 + EPSS·0.30 + KEV·0.25 + reachability·0.15 — exists precisely because
the population measured here is real and large: a severity-only sort over-ranks tens of
thousands of Criticals that EPSS and KEV both deem non-urgent. The tie is honest and
category-level. This study names no scanner and no vendor; it would produce the same
number whether or not Shield existed. It simply shows the gap that any multi-signal
prioritizer is built to close, versus the severity-only default.
Reproduce it yourself
Every input is a free, no-auth download. The join is deterministic, so anyone re-pulling the same three snapshots gets the same number:
- Pull the Critical universe from NVD:
GET https://services.nvd.nist.gov/rest/json/cves/2.0?cvssV3Severity=CRITICAL(paginate 2,000 per page). Record the snapshot date. - Download EPSS current scores:
https://epss.empiricalsecurity.com/epss_scores-current.csv.gz(read the leading#line to pinmodel_version+score_date). - Download the KEV catalog:
https://www.cisa.gov/sites/default/files/feeds/known_exploited_vulnerabilities.json(pincatalogVersion). - Left-join Criticals → EPSS on CVE ID; mark KEV membership; count rows below each threshold and not in KEV; divide by 30,409.
Limitations, stated plainly
- "Critical" = CVSS v3 base ≥ 9.0. CVEs scored only under CVSS v2, or unscored, are outside this universe by design.
- EPSS is a forecast, not ground truth. A low EPSS score means low modeled probability, not proof a bug is unexploitable. That's exactly why we pair it with KEV (observed exploitation) rather than relying on either alone.
- KEV is a floor, not a ceiling. It records confirmed in-the-wild exploitation; real exploitation is at least as broad. So "not in KEV" means "no public confirmation," not "never exploited."
- The numbers move as all three datasets update daily; the pinned snapshot identifiers make any given figure reproducible.
FAQ
Does a low EPSS score mean a vulnerability is safe to ignore? No. It means the modeled 30-day exploitation probability is low. This study pairs EPSS with KEV precisely so that a bug which is actually being exploited is never dismissed on probability alone — that's the point of using more than one signal.
Isn't "89.7%" just an artifact of a low threshold? It's one of three thresholds we report. At the stricter population-median cutoff the figure is 25.1%. We publish the full range so the reader sees how the result depends on where "low probability" is drawn, rather than cherry-picking one number.
Are CVSS, EPSS and KEV redundant? No — that's the finding. They disagree constantly. Severity (impact), probability (EPSS), and observed exploitation (KEV) are three different questions, and a queue built on only one of them systematically buries what the others would surface.
What data is this based on? Public NVD CVSS scores, the FIRST EPSS current-scores file, and the CISA KEV catalog — all free, all reproducible from the pinned snapshots named above.
Shield blends EPSS, KEV and reachability into one priority score, so the 1-in-10 'critical' that's actually exploited stands out.
See what Shield finds in your code
Free to start, no credit card. One pass covers SAST, secrets, vulnerable dependencies, containers and IaC — ranked by what’s actually reachable, not just severity.
Scan your repo freePrefer the terminal? The offline CLI runs with no account